The prompt for me to undertake a VO2 Max Test came from an odd source. At a charity gala where my daughter was volunteering, various products and services were being auctioned off. I got a call from her at the gala: “Did I want to bid for a VO2 Max test?” It seemed such an unlikely, specialized service to be offering but I said yes. Eventually, other bids exceeded the nominal value of the test and I wasn’t successful but my interest was piqued enough for me to book a test anyway.
My pre-instructions from the TCR Bike Shop – Fitness and Training, were simple, don’t do anything too strenuous the day before, wear cycle kit and bring your own shoes. I thought it would be a good idea to be fully hydrated too, so consumed a bottle of Scratch drink over the two hours before my appointment.
As I was booking in at the front test and completing the usual medical forms, a client who was just leaving wished me good luck. If I wasn’t nervous before, his cryptic message nudged up my anxiety a notch further. I wasn’t exactly sure what format the test would take though I believed it was a ramp type test where power was increased in steps.
Initially though, I was introduced to Jessica, a highly qualified exercise physiology assessor who was going to run me through the process over the next ninety minutes. The step test itself would take only a small part of that total time as first she needed to weigh me, measure my height and take my blood pressure. I seemed to have lost a centimetre, gained a kilogram and have slightly elevated blood pressure! Of the three measurements, only weight was relevant to VO2 Max as the results would be read per kilogram.

Did I know what VO2 Max was and what it signified? I admitted to being a bit vague but was aware that supermen like Pogačar had figures like 80+ of what whatever units were. I learned that VO2 max was the volume of Oxygen my body could usefully use to generate energy per minute and this value was rated against my overall mass. The heavier I was, the lower that figure would be. So, what did the value actually inform me? Essentially, how fit I was for aerobic activity.
Now, I was not born a natural endurance athlete. In high school cross-country running, I came home in the bottom 10% even though I could sprint well. Anything over 200m was a nightmare to me. I could hike and cycle long distances but it was only as I aged, that I managed to train myself to run longer distances and to cycle faster. Had my VO2 Max been higher as a youth I am sure I would have pursued competitive sport for longer. Consequently, I was keen to discover how my endurance fitness now compared with that of my cohort, 50 years later.
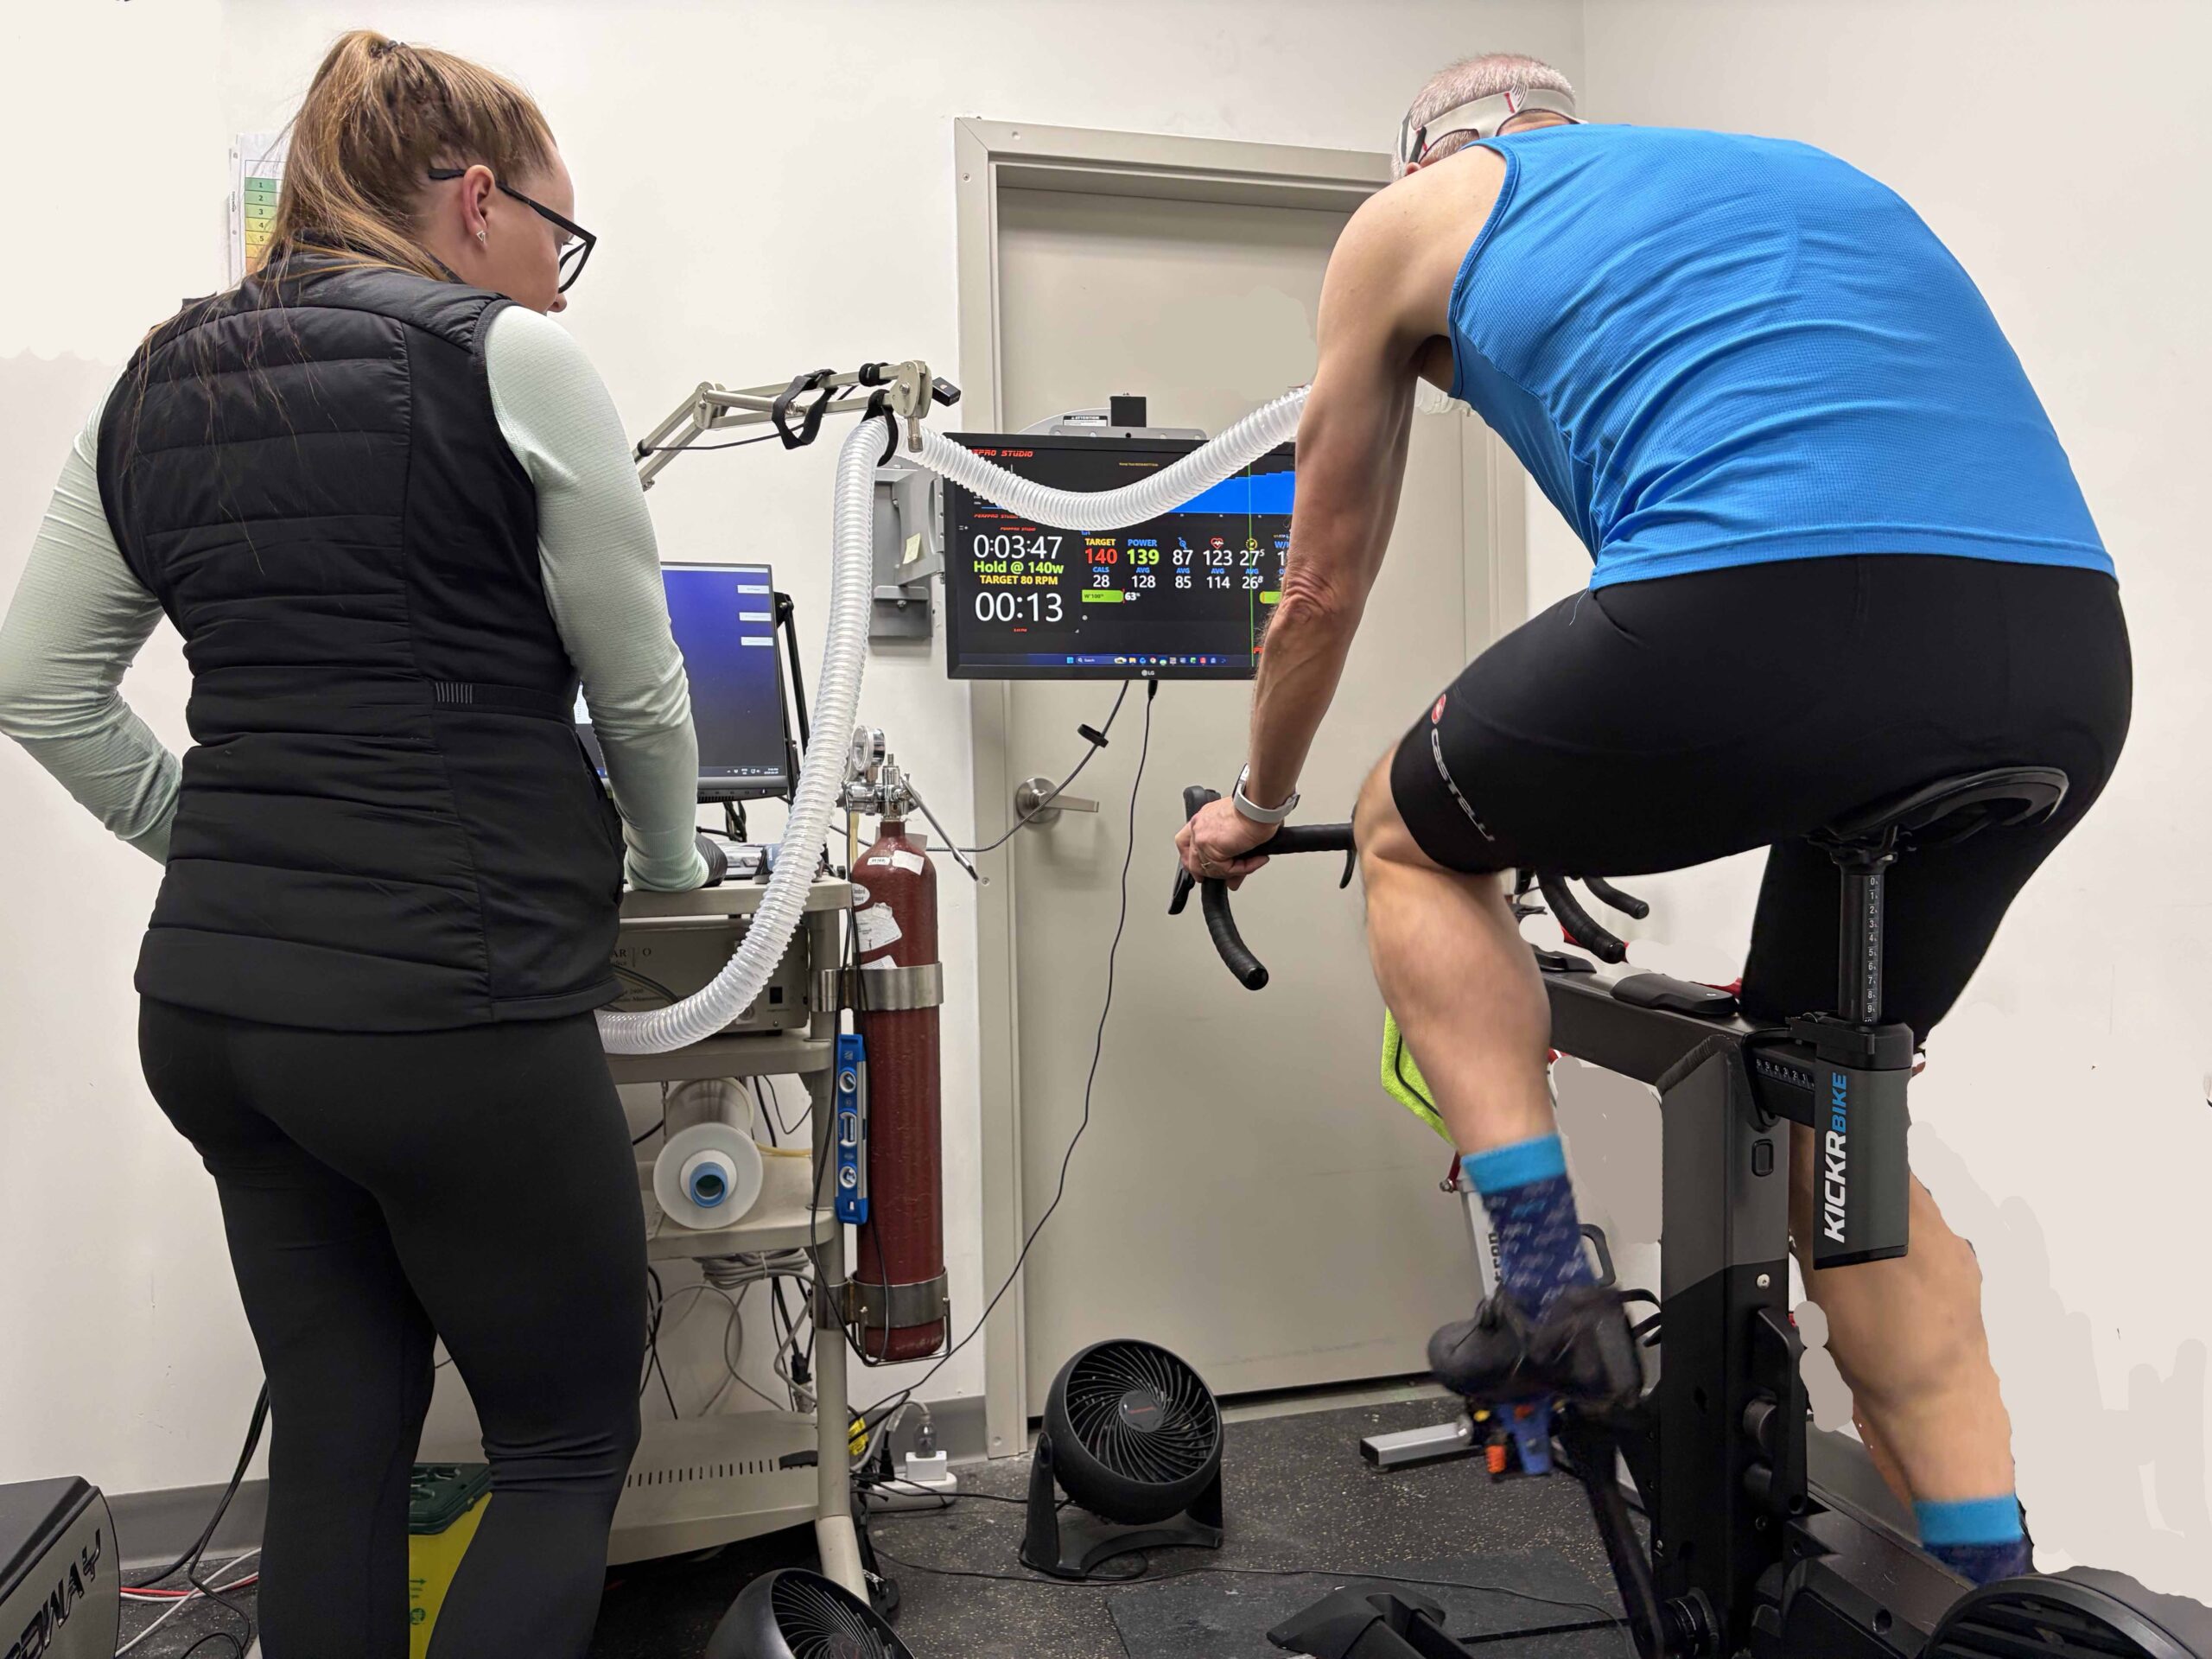
Before commencing the measured test, Jessica got me to put on the heart rate chest strap and shoes and sit on the saddle so she could adjust the test machine for my dimensions. After some finessing, I was satisfied with the set up and followed a gentle warm up program without wearing the mask. I rode at 40% and steadily up to 70% of my current Functional Threshold Power (FTP). It was a comfortable pace at 80 to 90 RPM pedal cadence so I was able to chat with Jessica about my future rides and plans for the year.

With the warm up complete, I got off the bike while Jessica selected a standard size mask and fitted the straps so it was tight to my face. Had I been running on a treadmill it would have been even tighter because of the bounce from running. As it was, I knew this new piece of equipment would bug me the most. There was very little resistance to breathing but occasionally the inlet valve would whistle gently so it sounded like I was wheezing.
Once I was seated back on the test bike, Jessica connected my mask to a clear pipe that looked like a skinny vacuum cleaner hose. The screen in front of me counted down to a big green GO sign and I began pedalling at 50% of my assumed FTP for two minutes. I aimed to keep my pedalling RPM at around 85 and didn’t initially pay much attention to the other figures displayed. At two minutes, the resistance increased by 20 Watts and I maintained around 85 PRM. This was like the ERG mode on a smart bike trainer where the force required to turn the pedals will increase if the cyclist reduces the pedalling rate, or reduce if the cyclist pedals faster.
By the third 20-Watt step, I was beginning to focus on the figure for my heart rate as it climbed. I was still reasonably comfortable but becoming more conscious of the mask. Ten minutes in and we reached my FTP so I was working hard and it was impossible to talk; I just acknowledged Jessica with a nod or thumb raise. Jessica’s gentle coaching had little persuasive impact on me as I had been conditioned in high school and the military by barking male coaches.

As my breathing rate increased, I was even more aware of the mask and found there was nowhere for snot and spit to go but down the tube. Normally a wipe with my towel would suffice. The steps were only a minute long after 220W and I was ok up to 260W when I noticed my heart rate was already over 150BPM which for me was quite high. We clicked up to 280W and I was starting to have trouble keeping the RPM high enough – in the low 80s. I was tempted to grind out the power at a lower RPM but I was struggling to breathe fast enough.
With seconds ticking by in the 280W minute, my heart rate hit 153 and I really wanted that mask off my face. I knew when I reached the 300W step, I would not get through the next minute. I wasn’t exactly panicking but, psychologically, I felt the mask was the cause of my breathing issues, and didn’t realize it was simply because I couldn’t breathe fast enough at that level of effort. At the 300W step I made the cut gesture to Jessica but she struggled for several seconds to unclip the mask.
While it felt good to be free of the mask, my breathing rate didn’t slow immediately as the mask wasn’t really the problem. Continuing to pedal at low power during the cool down period, I gradually got my breathing and heart rates down and stopped after 7 of the 10 suggested minutes.
Jessica began to process the results while I climbed off the bike to change into a tracksuit. I felt good as the overall exercise toll on me was relatively low. Waiting for Jessica, I took the opportunity to peruse the rest of the store and their physiological test facilities.
When the results were processed, I was presented with graphs and block diagrams but the figure I was most interested in was at the top of the page – 42.4 ml/kg/min. Was this what I had expected, she asked? I said I had hoped for something over 40 which Google had suggested was good for 60+ year olds. On TCR Lab scale, of Poor, Below Average, Average, Good and Excellent, my figure crept into the low end of the Excellent range. There was an additional figure for Ventilation in L/min where my figure of 145l/min was rated as Good.

We discussed whether I could have pushed further to the 300W step but Jessica showed me the VO2 against power curve which was already flattening suggesting I was at my limit. Any increase in power after that can only be generated anaerobically. Interestingly, the data suggested my true FTP was nearer 210W than the 220W I had been using. It is possible my own trainer bike set-up is measuring 5% too high as I have not recalibrated the Stages crank power meter for ages. Even so, from my VO2 Max figures, it looked like I should be able to increase my FTP a further 10 or even 15 %.
So, my Training Zones shook out approximately where I had expected. Recovery was at a power level of 145W or lower at a heart rate of 105 to 109 BPM. My Aerobic Zone 2 was 146-170W for a Heart rate of 120 to 130 BPM. Tempo would be 171 to 200W taking my heart rate from 131 to 138 BPM giving my Threshold of 200 to 220W at a heart rate of 139 to 147 BPM. Above this, my VO2 Max was 280W, the last level I had completed and this would be at 153 BPM. These were figures I could now enter to my TrainerRoad and Strava profiles.

Jessica explained further that I could still improve my respiratory rate. Some of her clients could reach 60 breaths a minute but it was important not to hyperventilate and to take in full breaths each time. The best way to gain this improvement was to ride at VO2 max levels for longer periods and practice forcing a high breath rate. Typical training programs only had you riding for 20 seconds or perhaps a minute at VO2 max but if you could ride for 2 minutes say, you would have to force your breathing to keep going.
We also discussed fueling on the bike, for my Zone 2 continuous riding power of 146 to 170W, it seemed I would need 54 grams of carbohydrate per hour. Above about 180W, all my fueling was by carbohydrate so any fat burning took place below that level. Jessica thought I should try to raise the % fat burning at each power level but whether this would be through fasted rides, like pre-breakfast or not I would need to investigate further myself.

Was this a worthwhile experience for the $160 expenditure? For a trained cyclist, the results give valuable information on your level of fitness compared with other riders and inform, to a certain extent, your strategy and potential to improve further. I still have some winter fat to burn off before the summer cycling season so my figure might have been higher, but it is not a test you need to undertake more frequently than annually. I will be monitoring my training zones more methodically in future though, using heart rate when I don’t have a power meter fitted.